Overview

OpenMarket's Dashboard provides you with data visualizations that help you track the performance of your messaging campaigns. You get access to the following dashboards:

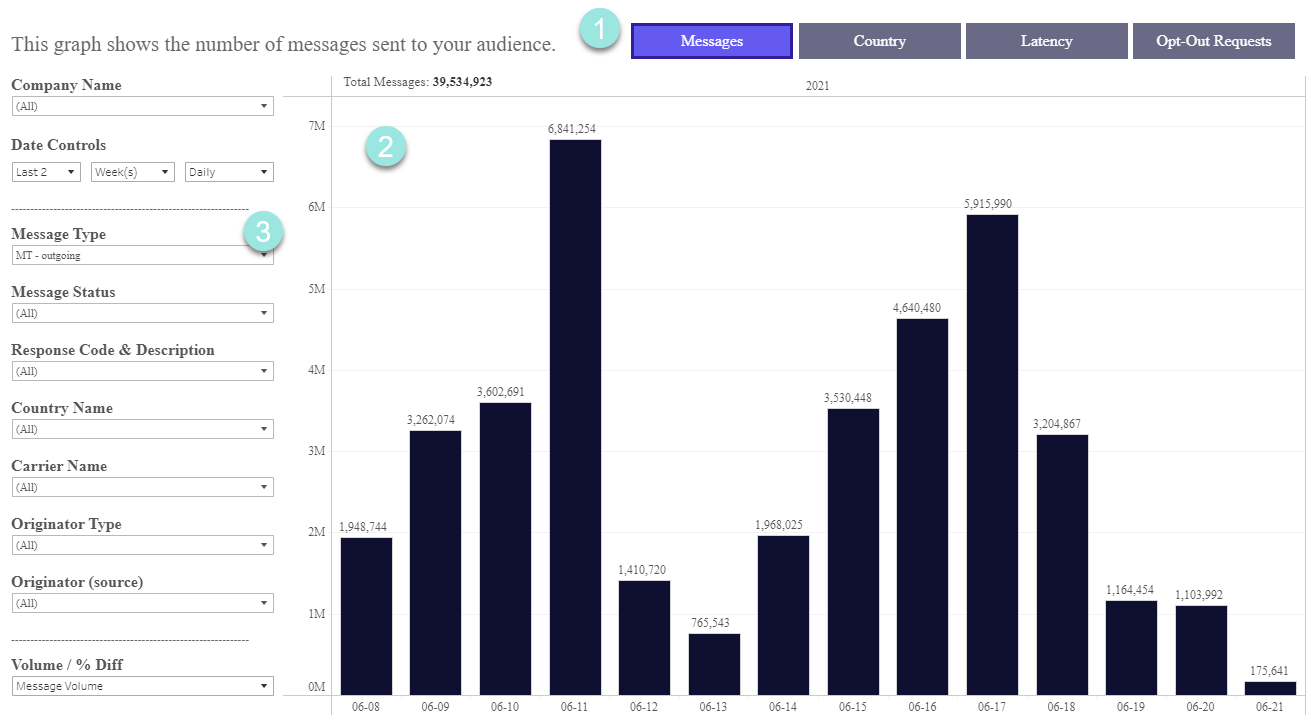
  • Messages: Shows the volume of MT and MO messages during a given date range.
  • Latency: Shows the volume of messages that were accepted within certain point in time to detect delays.
  • Opt-Out Requests: Shows the volume of messages to which customers replied with a request to opt out.

Designed to be easy to use, all dashboards contain a data visualization tool with filters that let you quickly get the most meaningful perspective on your data.

OpenMarket provides free training to help you make the most out of our reporting tool. Contact your Account Manager for more information about this service.

How to access Dashboard

To access dashboards, you first need to contact your OpenMarket account manager so that they can give you a quick orientation and set up your account with the necessary permissions. Once that's done, you can view them within Customer Portal.

  1. Access Customer Portal at https://customers.openmarket.com

  2. From the top navigation menu click Analyze and select Dashboard.

Note: The Analyze dashboards use the SMS Summary data source. This data source refreshes daily at 00:20 UTC and contains SMS-only message volume and status data. Support for MMS and RCS in Analyze is coming, please see MMS Reporting in the meantime.

General features

All dashboards have the same general structure. The three areas you'll want to be familiar with are:

  1. Dashboard tabs allowing you to access different dashboard types.
  2. The view area that contains the data visualization.
  3. The filters area

Features of a dashboard

Dashboard tabs allow you to toggle between available dashboards. Selecting any tab automatically updates the View area.

The View area displays a data visualization graph of the information by which you filtered. Applying filters automatically updates the graph.

Click on any bar on the graph to display a pop-up box with additional options:

  • Keep Only: keep only that bar in your overall view.
  • Exclude: remove that particular bar from your overall view.
  • View Data: view a summary of that bar with the option to download it to a CSV file.

The filters section allows you to further refine the information displayed in the View area. Some filters options will change depending on which dashboard you've selected.

Note: Typically, filters update the data automatically as soon as you select the option. However, there's a number of filters for which you'll need to click Apply after selecting options(s) you want to include in your data view.

  • Company Name: Displays the name of the company for which you are generating report data. Only companies for which you have permission to generate data are returned in the drop-down list.
  • Date Controls: Allows you to set the timeframe for the data set you wish to analyze. By default, the dashboard shows data for the last 2 weeks in daily increments.
  • Message Type: Allows you to filter out incoming or outgoing messages, or select both options. By default, only outgoing messages are selected. Select the All check box to select or clear all options.

    • All - returns both MTs and MOs in the totals.

    • MO - incoming- returns totals for MOs only.

    • MT - outgoing - returns totals for MTs only.

  • Message Status filters on the the status in a delivery receipt. By default, all options are returned. Select the All check box to select or clear all options.

    • All - Returns all message totals, regardless of the status.

    • Awaiting Report - Returns the totals of messages waiting on delivery status from the mobile operator. We forwarded the message to the operator; however, we have not yet received a delivery receipt.

    • Delivered - Returns all messages confirmed as delivered to the end user.

    • Failed - Returns the total of all failed messages. This total does not include those waiting for a receipt.

    • Read - Returns the total of all opened messages

    • Success - Equivalent of the Delivery status used by some carriers.

    • Unknown - Equivalent of the Awaiting Report status used by some carriers.

  • Response Code & Description: Allows for filtering on the particular response code returned in the delivery receipt. By default, all response codes are selected.

    Country Name allows you to filter on one or more countries in which you operate. By default all countries are selected. Select the All check box to select or clear all countries.

    Note: Only countries in which you operate are returned in this list.

  • Carrier Name: Allows to filter on specific mobile operators. By default, all operators are returned. Select the All check box to select or clear all options.
  • Originator Type: Returns a list of the types of originators also referred to as sources. By default, all types are returned. Select the All check box to select or clear all options.
  • Originator (source): Returns a list of the source numbers on your account. By default, all sources associated with your account are returned. Select the All check box to select or clear all options.
  • Volume / % Diff: Returns the message volume or the percentage difference in message volume. By default, total number of messages is selected. This filter is only available for the Messages dashboard.
  • Latency: Allows to choose the percentage of messages accepted within a specific point in time. This filter is only available for the Latency dashboard.
    • % Delivered Within 10 seconds - the percentage of messages delivered within 10 seconds from sending.
    • % Delivered Within 30 seconds - the percentage of messages delivered within 30 seconds from sending.
    • % Delivered Within 90 seconds - the percentage of messages delivered within 90 seconds from sending.